A 2D flow visualization tool based on Line Intergral Convolution (LIC) and Runge-Kutta 4 (RK4). Developed using C++ and VTK.
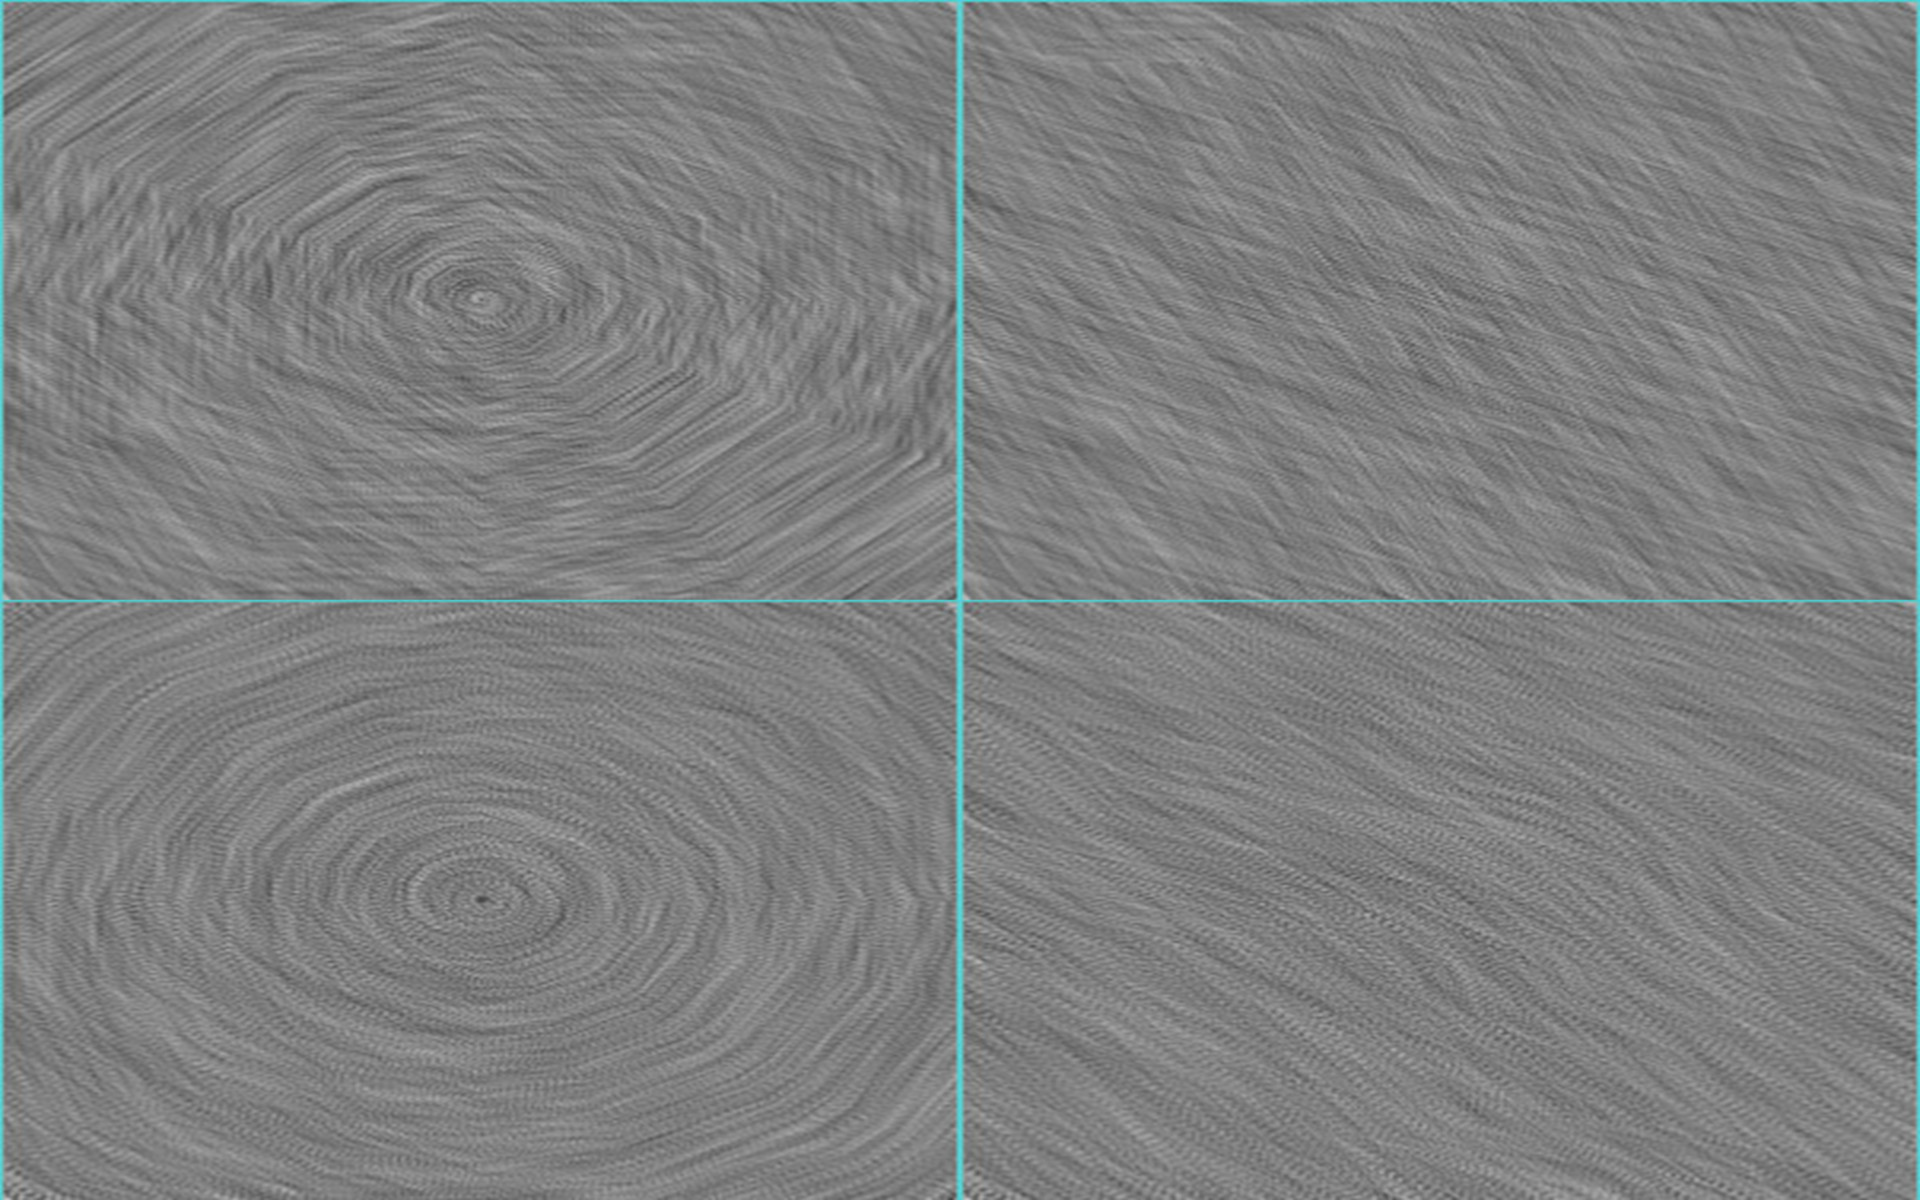
After executing the program a console window will open asking for the vector file to be loaded. Type 1 for the circle data, or 2 for the wind data. Next, the program asks for the value of L (the length of the streamlines). Finally, the program asks for the value of h (the step value for the Runge-Kutta algorithm). The program generates a vector field visualization image of 300 x 300 pixel. For each pixel in the generated image it is interpolated the respective 2D vector from the original data. Such vector is obtained using Bilinear Interpolation. For finding the streamlines it is implemented the Runge-Kutta (RK4) algorithm. Finally, a Gaussian kernel is applied to the streamlines during the Line Integral Convolution method for the vector field visualization image. The overall method is described in Imaging Vector Fields Using Line Integral Convolution by Cabral and Leedom.
It is observed that as h increases there is a visual -granularity- effect in the image. This is caused by the gaps left by the RK4 algorithm while finding the streamlines, which means that some pixels were not considered for any streamline in the image. Additionally, it is observed that by increasing L there is a better definition of the streamlines; however, it increases the image generation time considerable since longer streamlines are being searched.
The program requires VTK. Please download it, compile and install before running this program.